

It is the middle of the month and the deposit report does not add up. The center is busy. The parking lot is full at drop-off, every teacher is with a group of kids, and yet the number at the bottom of the account is smaller than it should be, again. You have a rough feeling that one of your rooms is quietly bleeding money, but you could not tell me which one, or by how much, if I put you on the spot right now.
Here is the answer up front. Every classroom has a break-even number, and it is not a dollar figure, it is a fill rate. Because your state ratio forces you to staff a room before the kids show up, the room has a fixed cost that barely moves whether you have five children in it or a full house. So the real question is never “what should tuition be.” It is “how full does this room have to be, every week, before it stops losing money.” For an infant room the honest answer is usually above 90 percent full. For a preschool room it can be under half. This post shows you how to work out that number for each room in about fifteen minutes, with real 2026 costs, and what to do when the math comes back ugly.
What this post covers
- Why a whole-center P&L hides the problem
- The six steps to your break-even fill rate
- Worked example: an infant room in 2026
- Break-even by room type
- Steal this: the one-page worksheet
- Run it three ways by center size
- Where the empty seats come from
- Texting parents: the rules
- Your questions, answered
Why a whole-center P&L hides the problem
Most directors watch the bank balance, or read a monthly profit-and-loss statement that shows the whole center on one page. Both hide what is actually hurting you. A whole-center P&L blends your money-losing and money-making rooms into one number. If the center clears a small profit, everyone relaxes, and nobody notices the infant room lost eight hundred dollars a month all year while the preschool rooms covered it, right up until a preschool family gives notice and the cushion disappears.
This matters more in childcare than in most small businesses because of the cost structure. Payroll is not one line among many, it is the whole game. The U.S. Treasury puts labor at roughly 60 to 80 percent of a provider’s costs, and the Bipartisan Policy Center says most providers spend at least 60 percent of revenue on wages while running under one percent profit. When your biggest cost is set by a state ratio, room by room, you have to do the math room by room.
The six steps to your break-even fill rate
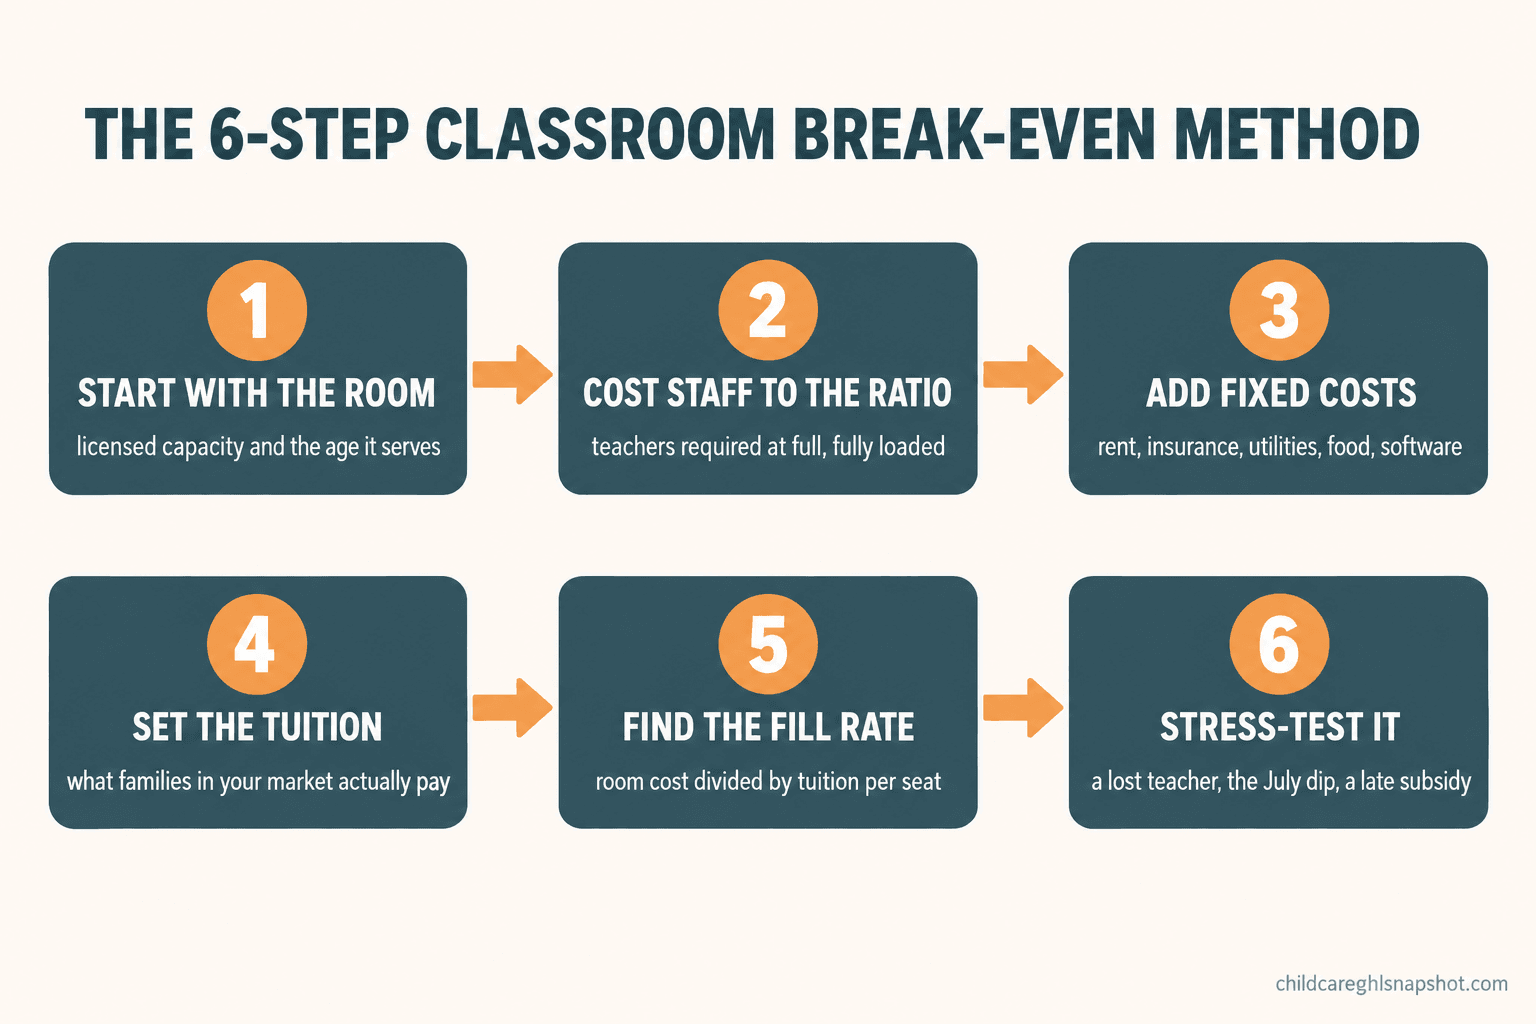
The method fits on the back of an envelope. Six steps, one room at a time.
Step 1. Start with the room, not the roster. Write down the licensed capacity and the age it serves. Capacity is capped by square footage and the staff-to-child ratio. The ratio is the one that costs you money, because it sets how many adults you must pay.
Step 2. Cost the staff to the ratio. Divide capacity by the ratio and round up for the minimum teachers you need at full. Multiply by the fully loaded cost of a teacher, not the hourly wage. This is where most directors undercount.
Step 3. Add the costs that do not care how many kids are in the room. That room’s share of rent or mortgage, insurance, licensing, utilities, cleaning, and flat-rate software. These are fixed, and show up whether the room is empty or full.
Step 4. Set the tuition against your actual market. Not what feels comfortable, but what families in your zip code actually pay for that age. Sanity-check against the national average price of care, reported by Child Care Aware of America at $13,128 a year in 2024, knowing infant care runs well above that.
Step 5. Find the break-even fill rate. Divide the room’s total monthly cost by the monthly tuition per seat for the paying seats you need. Divide that by capacity for your break-even occupancy, the percentage of the room that must be full and paying every week.
Step 6. Stress-test it. What happens when a teacher quits and you drop out of ratio, or in the July dip, or when a subsidy payment lands three weeks late? The break-even number tells you how much cushion you have before those normal events tip the room into a loss.
Worked example: costing an infant room in 2026
Let me run it for the hardest room in the building: a Texas infant room.
The room. Texas licenses infant care at one adult to four babies for ages zero to eleven months, under 26 TAC Chapter 746. Say the room is licensed for eight infants.
The staff. Eight babies at 1 to 4 means two teachers any time the room is open. At a fully loaded cost of about $40,000 each, that is $80,000 a year in labor for one room.
The rest. Labor runs around two-thirds of a center’s costs. So if $80,000 is two-thirds of the total, the whole room costs roughly $120,000 a year, about $10,000 a month, once you add its share of rent, insurance, food, and supplies.
The tuition. Say infant tuition in your market is $1,300 a month, a real mid-range figure for center-based infant care in 2026 that runs higher in costly states.
The break-even. The room costs $10,000 a month and each seat brings in $1,300. Divide: that is about 7.7 seats, and the room only holds eight. So this infant room has to be roughly 96 percent full, every week, just to break even. One empty crib and you are underwater.
That is not a pricing failure, it is the math of the ratio. Two full salaries sit on only eight seats, which is why infant care usually loses money as a standalone room.
Break-even by room type: why the babies lose money
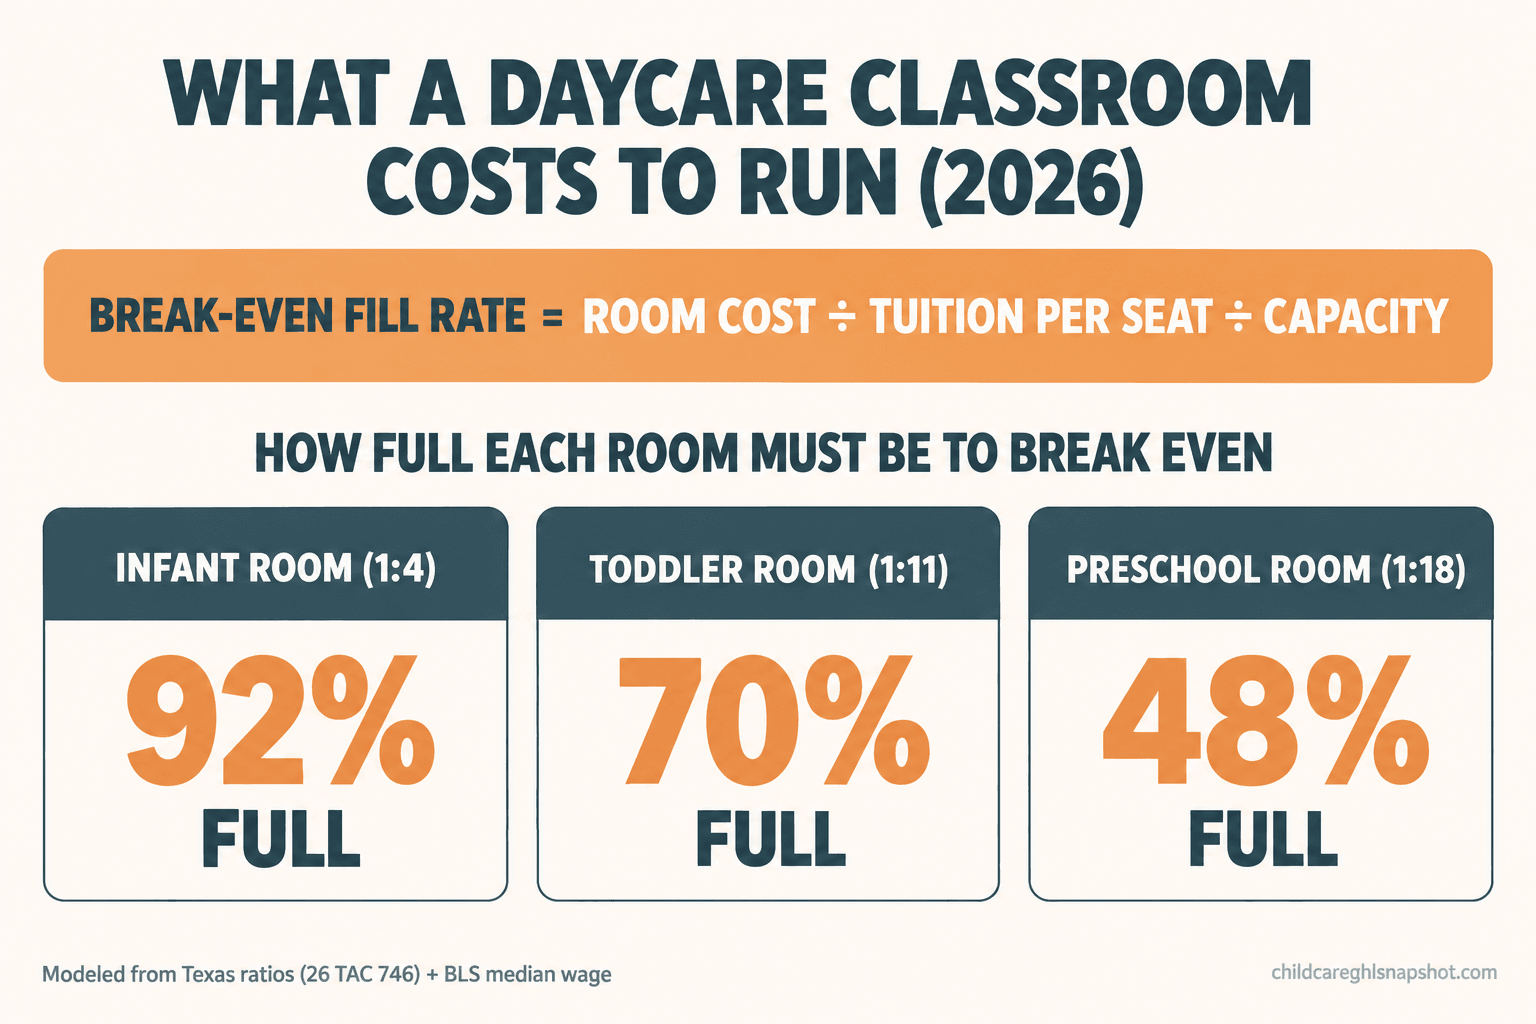
Now do the same for the other rooms. As the licensed age goes up, the ratio loosens, one salary spreads across more seats, and the break-even fill rate drops fast. Here is the same calculation across three Texas room types.
Modeled break-even by room type (Texas ratios, 2026)
| Plan | Infant room | Toddler room | Preschool room recommended |
|---|---|---|---|
| Price | ~92% full to break even | ~70% full to break even | ~48% full to break even |
| Feature 1 | Age 0 to 11 months | Age ~2 years | Age ~4 years |
| Feature 2 | Ratio 1 to 4 | Ratio 1 to 11 | Ratio 1 to 18 |
| Feature 3 | 8 seats, 2 teachers | 11 seats, 1 teacher | 18 seats, 1 teacher +aide |
| Feature 4 | Tuition ~$1,300/mo | Tuition ~$1,050/mo | Tuition ~$900/mo |
Modeled by the author from Texas ratios in 26 TAC Chapter 746 and the BLS median childcare wage, loaded 25 percent for payroll burden. Your numbers will differ. Use this as a shape.
Read that table again, because it is the most important thing here. Your infant room breaks even near full, your preschool room at under half. So your preschool rooms subsidize your infant room every month, whether you have said so or not.
Modeled break-even occupancy by room type: the percent of licensed seats that must be filled and paying to cover the room. Derived from Texas ratios and the BLS median wage; illustrative, not a quote for your center.
It is also why a center that “grows” by adding infant capacity can grow straight into a cash crisis: those rooms have the worst break-even math. Here is where a typical tuition dollar goes, and why there is so little slack.
Approximate share of a center’s operating costs. Labor is the dominant line at roughly two-thirds, consistent with the Bipartisan Policy Center and U.S. Treasury. Splits vary by center.
Steal this: the one-page classroom worksheet
You do not need software for this. One page per room, fifteen minutes a term. Copy this, fill in your real numbers, and you will know more about your center than most owners ever do.
CLASSROOM BREAK-EVEN WORKSHEET
Room and age: ________ · Licensed capacity: ________ · Ratio: 1 to ________ Teachers required at full (capacity ÷ ratio, rounded up): ________
Monthly cost of this room Teachers required × fully loaded monthly cost per teacher: $________ This room’s share of rent / mortgage: $________ Food, supplies, consumables: $________ Share of insurance, licensing, utilities, software: $________ A. Total monthly room cost: $________
B. Tuition per seat, per month (what families actually pay): $________
Your break-even Break-even seats = A ÷ B = ________ · Fill rate = (seats ÷ capacity) × 100 = ________%
Monthly check: seats filled and paying × B, versus A. If it is smaller, the room lost money this month, by exactly the gap.
That last line is the whole point. Once a month, per room, multiply the seats that actually paid by the tuition and compare it to the room cost. Not enrolled seats, paying seats. A crib held for a family starting in three weeks is not paying yet, and a spot held for a late-reimbursing subsidy is not paying on time. The gap between “enrolled” and “paying this month” is where centers get surprised.
Run it three ways: home daycare, mid-size, and multi-site
The break-even math is the same everywhere, but what you do with the answer changes a lot with your size.
The home daycare (about 8 to 12 children, one mixed room)
You are often one of the ratio-counted adults, which cuts both ways. Your own labor may not draw a full salary, so the biggest cost line shrinks, but your capacity is tiny, so one empty spot is a huge share of the room. Pay yourself a real wage in the numbers even if you do not take it in cash. A home daycare that only works because the owner is unpaid is not breaking even, it is subsidizing itself with your time.
The mid-size center (about 60 children, four to six rooms)
This is where the room-by-room view pays for itself. Run the worksheet for every room and you find the same shape: the infant and young-toddler rooms lose or barely cover, and the preschool rooms carry the building. Know it precisely so you can protect the rooms that carry you, because losing one preschool family can vanish the whole-center cushion.
The multi-site group (about 150 children across locations)
At this scale you get a new failure mode: an average that lies across sites. Group numbers can look healthy while one location runs chronically under-enrolled and drags the rest. Each site must clear its own break-even, and each room within it. Central overhead (a director’s salary, shared admin, marketing) pushes every site’s break-even fill rate a notch higher, so watch occupancy per room per site, not total headcount.
Where the empty seats actually come from
Once you have your break-even fill rate, the game is occupancy. And here is the uncomfortable part: for most centers the empty seats are a follow-up problem, not a demand problem. The Center for American Progress reports 46 percent of children under six live in a licensed child care desert, so families are out there looking. Yet NAEYC found in early 2025 that more than half of program administrators had fewer children enrolled than they wanted. Demand high, enrollment low.
The seats leak out in a few predictable places, and none is about parents not wanting care:
The inquiry nobody called back. A family fills out your website form at 9pm, the only quiet minute they get. The first center to answer usually wins the tour, so a form that sits until tomorrow is a seat handed to the center down the road. Industry write-ups say parents tour around 3.2 centers before deciding, an industry-reported figure rather than research, but the point holds: being slow drops you off a short list.
The tour that no-showed. A booked tour that does not walk in is a filled seat that evaporated, and without a confirmation-and-reminder sequence a big share quietly vanish. There is a whole playbook for cutting tour no-shows that pays for itself in one recovered family.
The waitlist that went cold. A spot opens in July and half the March list have already enrolled elsewhere. A waitlist you do not nurture is just a list of people who used to be interested.
The ratio cap you created yourself. If a teacher quits and you drop out of ratio, you legally cannot enroll the next child even with a waitlist out the door. Revenue is now capped by staffing, not demand, which is why teacher retention belongs in the same conversation as break-even.
Fixing any of these is about speed and consistency of contact, not a spreadsheet, and most management software does not do it. It is why we built our enrollment automation system to sit alongside whatever app you use, handling inquiries, tours, and the waitlist so your rooms reach the fill rate the math needs. If you would rather build it yourself, we wrote an honest build-versus-buy comparison, and here is what the childcare tools actually charge in 2026.
A word on texting parents before you automate
The moment you automate parent contact to keep seats full, two rules apply. If you text families, whether about a tour, a waitlist opening, or a tuition reminder, the TCPA governs consent for automated texts and A2P 10DLC is the carrier registration business texting now requires. In plain terms: get a clear opt-in before you text a family, and register your number, or your messages get filtered into nowhere.
On child records, clear up one myth. FERPA, the school-records law, generally does not apply to a private licensed daycare, so do not let a vendor use it to sell you something. Your real obligations come from your state’s licensing rules on child-record confidentiality and on photo and video consent, which you cannot make a condition of enrollment. The line to hold: never name or show a specific child in marketing without consent on file, and keep any automation touching attendance or health data in the parent-only channel, never feeding the marketing list. Fill seats aggressively, market children carefully.
Your questions, answered
How do I calculate the break-even point for a daycare classroom?
Add up the room's total monthly cost (mostly the teachers your ratio requires at full capacity, loaded for payroll taxes and benefits, plus its share of rent, food, insurance, and software). Divide by the monthly tuition per seat for the paying seats you need, then divide by capacity for your break-even fill rate.
Why do infant rooms lose money?
The ratio. Infant care is commonly one adult to four babies, so a room of eight needs two teachers no matter what. Two salaries on only eight seats means the room often must run above 90 percent full to cover itself, so infant rooms tend to lose money and get subsidized by preschool rooms.
What percent full does a daycare need to be to break even?
It depends on the room. Modeled on Texas ratios and median wages, an infant room can need around 90 percent, a toddler room around 70 percent, and a preschool room under 50 percent, because looser ratios spread one salary across more seats. Calculate it per room, not for the whole center.
How much does it cost to run a daycare classroom per month?
For a full infant room of eight in 2026, plan on roughly $10,000 a month once you load teacher wages for payroll burden and add the room's share of rent, food, insurance, and software. Labor alone is about two-thirds. Preschool rooms cost less per seat under a looser ratio.
Should I just raise tuition to break even?
Price matters, but occupancy comes first. A half-empty room loses money at any tuition, because the ratio-driven staffing cost is fixed. The bigger lever is filling the seats you are already licensed and staffed for, then pricing honestly, especially on infant rooms.
Doesn't my bookkeeper already track this?
A whole-center profit-and-loss statement blends your money-losing and money-making rooms into one number and hides which room is the problem. The break-even worksheet is the per-room view your P&L does not give you. The P&L says if the center is fine overall, the worksheet says which room to fix.
So, back to that deposit report. Print the worksheet, do one page per room this week, and you will find the room that is bleeding, usually the youngest one, and the exact fill rate that turns it around. The margins here are famously thin, under one percent for most providers, which is exactly why knowing your number per room is not homework. It is the difference between a center that quietly loses money in one corner and one that fills every seat on purpose.